
Unless there is some dramatic change in the next few weeks, this will be the last of my weekly updates for now.
The solid blue line shows the weekly number of deaths in England and Wales over the period of the pandemic. The solid grey line shows the average over the last five years.
Taking the UK as a whole, the total excess for this year over the average is about 62,000, roughly 0.1% of the population. The number of reported covid-19 deaths at that point was 36,675. The total death count is still nearly 70% higher than being reported.
In my humble opinion, we urgently need to know why the reported covid-19 deaths and the total excess deaths are so vastly different. Obviously there could be numerous reasons for this, such as people avoiding necessary A&E visits, lack of sufficient ICU beds, virus deaths being misdiagnosed as old age. Whatever the reason, we need to know so that a similar situation can be mitigated against if we fall victim to a second wave after restrictions are lifted.
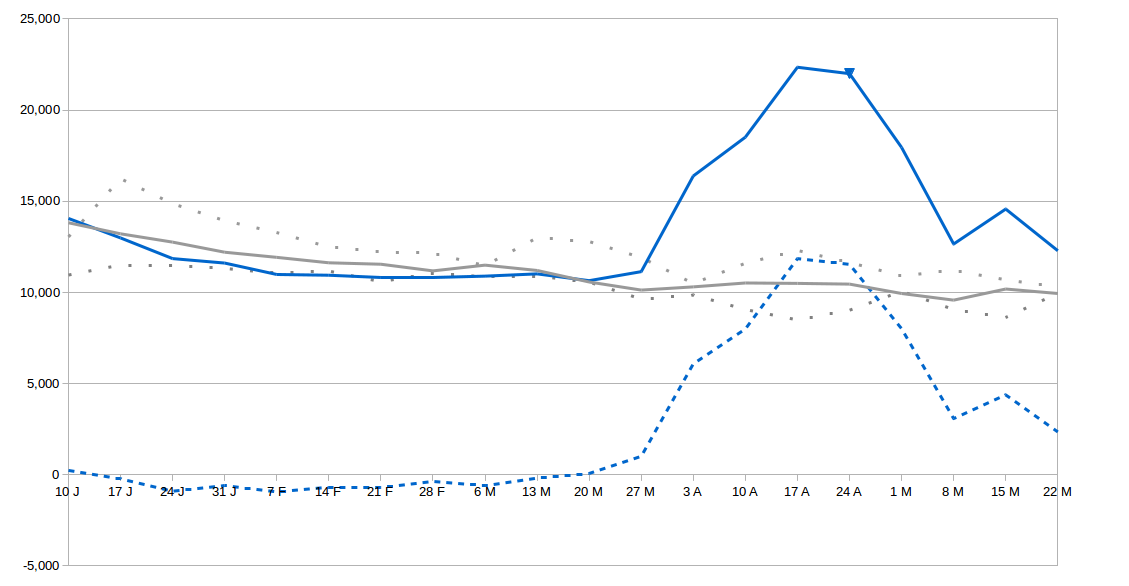
The dotted grey lines show the max and min weekly deaths over the last five years.
The dotted blue line is the excess deaths.
I’ve also included one last look at a comparison of the UK (green) vs. Sweden’s (grey) daily death counts. They’re suprisingly similar given the enormous differences in approach taken by the UK and Swedish authorities.
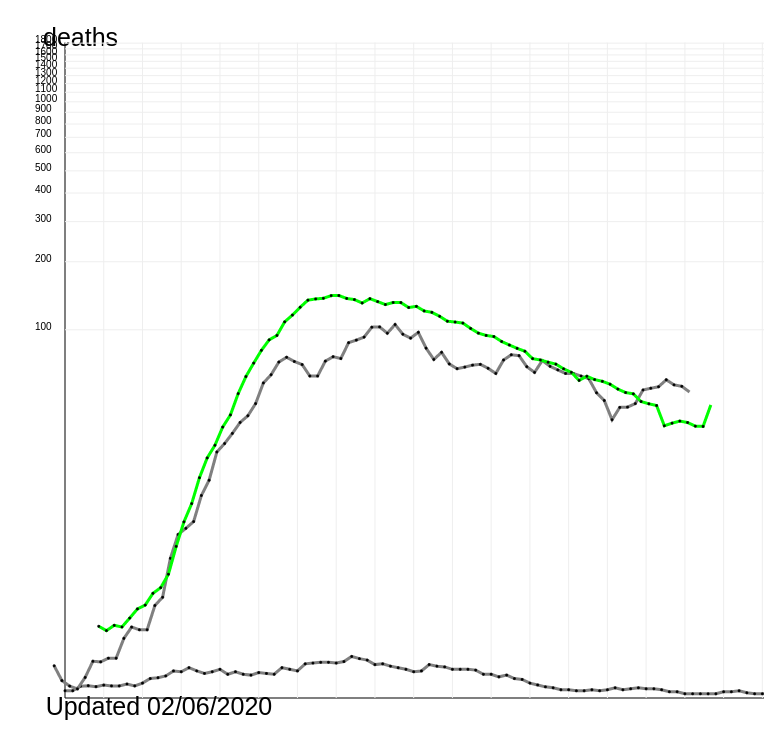
Of course, there are far too many variables to directly compare the UK and Swedish experiences. A comparison between Sweden and other Nordic countries is probably more appropriate. I’m sure there are research groups studying these figures carefully. It will be interesting to see what conclusions, if any, they eventually reach.
South Korea (lower grey line) is included for comparison.
